Bokeh
Bokeh is a data visualization library that allows a developer to code in Python and output JavaScript charts and visuals in web browsers.
Why is Bokeh a useful library?
Web browsers are ideal clients for consuming interactive visualizations. However, libraries such as d3.js can be difficult to learn and time consuming to connect to your Python backend web app. Bokeh instead generates the JavaScript for your application while you write all your code in Python. The removal of context switching between the two programming languages can make it easier and faster to create charts and visualizations.
What do Bokeh visualizations look like?
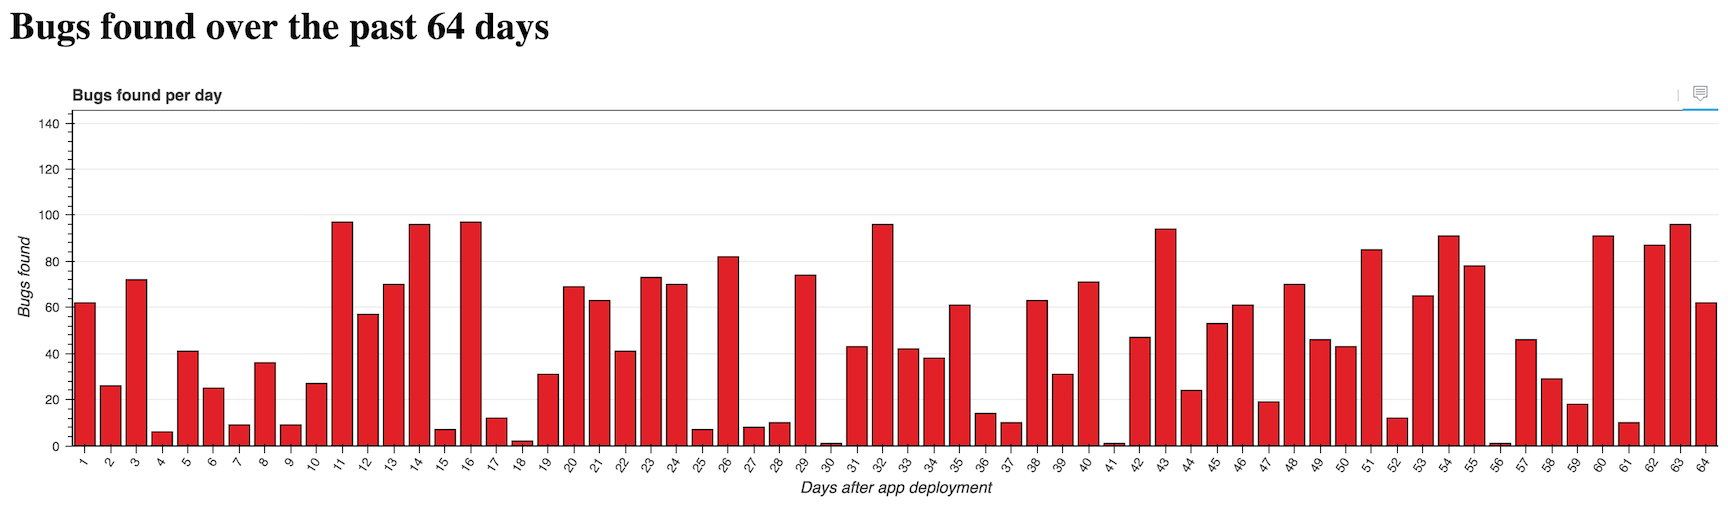
Bokeh can create any type of custom graph or visualization. For example, here is a screenshot of a bar chart created with the figure plot:
For more references, including interactive live demonstrations, check out these sites:
-
The official Bokeh gallery has many example Bokeh visual formats.
-
Bokeh Applications hosts numerous data visualizations built with Bokeh.
Bokeh resources
Bokeh is under heavy development ahead of the upcoming 1.0 release. Note that while all of the following tutorials are useful, it is possible some of the basic syntax will change as the library's API is not yet stable.
-
Integrating Bokeh Visualisations Into Django Projects does a nice job of walking through how to use Bokeh to render visualizations in Django projects.
-
Responsive Bar Charts with Bokeh, Flask and Python 3 is my recommended tutorial for those new to Bokeh who want to try out the library and get an example project running quickly with Flask.
-
Fun with NFL Stats, Bokeh, and Pandas takes an NFL play-by-play data set, shows how to wrangle the data into an appropriate format then explains the code that uses Bokeh to visualize it.
-
Visualizing with Bokeh gives a detailed explanation with the code for number Bokeh visuals you can output while working with a pandas data set.
-
Interactive Data Visualization in Python With Bokeh is a great beginners tutorial that shows you how to structure your data, draw your first figures and add interactivity to the visualizations.
-
Creating Bar Chart Visuals with Bokeh, Bottle and Python 3 is a tutorial that combines the Bottle web framework
-
Building Bullet Graphs and Waterfall Charts with Bokeh covers buildings two types of useful visualizations into your applications using Bokeh.
-
Interactive Visualization of Australian Wine Ratings builds a non-trivial visualization with a nice sample set of data based on wine ratings.
-
Drawing a Brain with Bokeh is a fun example of a chord diagram that represents neural connections in the brain.
-
Bryan Van de Ven on Bokeh is a podcast episode by one of the main Bokeh maintainers.
-
The Python Visualization Landscape by Jake VanderPlas at PyCon 2017 covers many Python data visualization tools, including Bokeh.
-
This flask-bokeh-example project has the code to create a simple chart with Bokeh and Flask.
-
Realtime Flight Tracking with Pandas and Bokeh provides a great example of combining pandas for structuring data with Bokeh for visualization.
-
How to Create an Interactive Geographic Map Using Python and Bokeh shows how to use a
GeoJSONDataSourceas input for Bokeh and draw a map with the data.
What else would you like to learn about Python and data?
Full Stack Python
Updates via Twitter & Facebook.